13. Analytics & Reports
Track your business performance with data-driven insights.
Note: Reports and Advanced Metrics require an active Pro subscription. The compact summary on the home Dashboard is available separately.
13.1 Home Dashboard Summary
The home Dashboard is an operational snapshot. It tells you what needs attention now; it is not a historical report with one date range applied to every card.
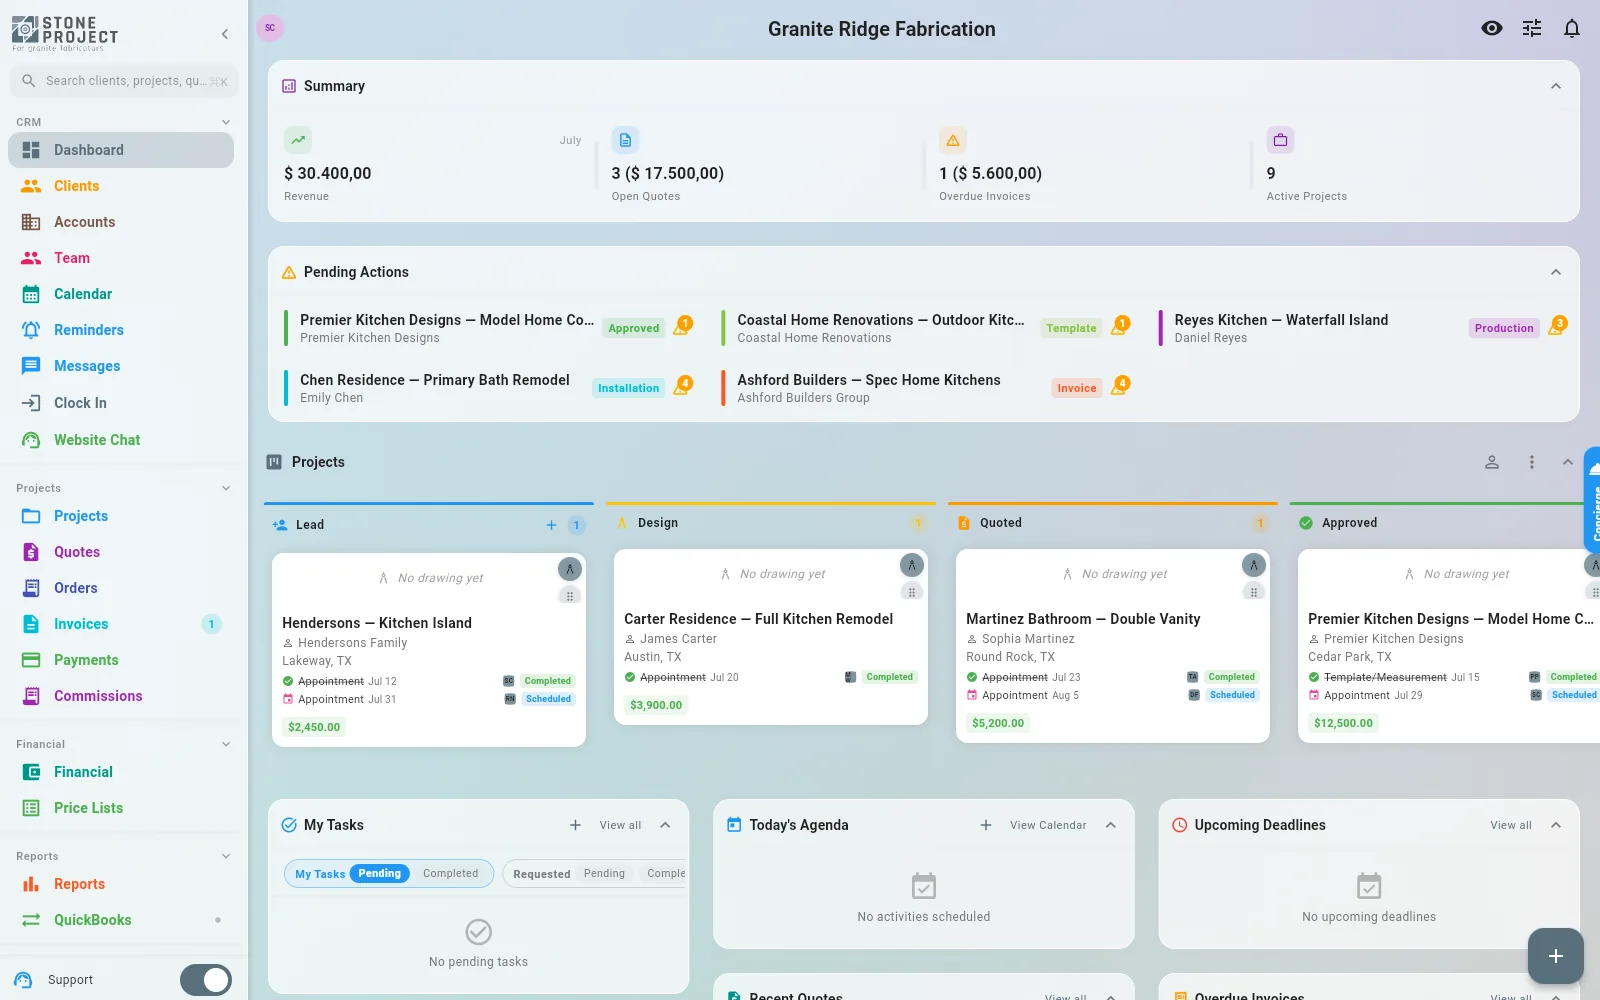
What each card means
| Card | Frame | What it counts |
|---|---|---|
| Revenue | Current calendar month | Completed payments dated inside the month: money collected, not the value of invoices or orders created. |
| Open Quotes | Right now | Quotes that are currently in Sent status. |
| Overdue Invoices | Right now | Invoices that are past their due date and still have an unpaid balance. |
| Active Projects | Right now | Projects whose current stage is neither final nor cancelled. |
The month name appears on Revenue, while the other three cards say Right now. There is no global date selector on this row because a range would change the meaning of the three live-status cards. For example, an invoice can still be overdue today even if it was created months ago.
Analyze a period instead
Open Reports when you need Today, Yesterday, This Week, This Month, This Quarter, This Year, All Time, or a custom start and end date. Reports measures booked sales from orders in the selected period.
From Reports, click the insights icon in the top bar to open Advanced Metrics. Its financial Dashboard compares order revenue with the previous comparable period and also shows gross profit, square footage, average order value, and cost metrics.
Dashboard Revenue and report revenue can differ without either being wrong: the home Dashboard counts completed payments collected this month; Reports and Advanced Metrics count order value booked in their selected period.
13.2 Sales Metrics
Track your sales performance:
| Metric | Description |
|---|---|
| Total Sales | Revenue from all completed transactions |
| Average Sale Value | Average invoice amount |
| Pieces Sold | Number of pieces sold in the period |
| Top Selling Materials | Most popular stone types |
| Revenue by Category | Breakdown by stone type |
| Outstanding Invoices | Unpaid invoice total |
How many quotes became a sale (conversion)
In Reports → Sales, the Sales by Salesperson card answers the month-end question: how many quotes each person wrote, how many were approved, and the conversion rate. Pick This Month at the top, and use the share button to take it out as PDF or CSV.
Two things worth knowing before you compare numbers with someone:
- The rows follow the jobs opened in the period. A quote written this month on a job opened last month counts in last month's row, and a revision that replaced an older quote is not counted twice.
- The rate divides approved quotes by jobs opened, so a job that sells two quotes can put one salesperson above 100%.
How many invoices you issued in a month
Open Invoices, set Start Date and End Date in the filter, and read the row of figures above the list: Total, Draft, Sent, Partially Paid, Paid, Cancelled, Outstanding and Overdue, all counted for that period. Each figure is also a filter — tap Paid or Outstanding to see exactly those invoices.
Sales Charts
- Revenue over time — Line chart showing monthly/weekly revenue
- Sales by material — Pie chart of sales distribution
- Monthly comparison — Compare current period to previous
13.3 Piece Performance
Understand how your listings perform:
| Metric | Description |
|---|---|
| Most Viewed Pieces | Top pieces by view count |
| Most Favorited | Top pieces by favorite count |
| Views Trend | How piece views change over time |
| Pieces by Status | Breakdown by available, reserved, sold |
| Pieces by Stone Type | Distribution across material types |
Insights
The app provides actionable suggestions:
- Pieces with high views but low inquiries may need better photos or pricing.
- Stale listings might benefit from a price adjustment or better description.
- Top-performing materials indicate market demand in your area.
13.4 Financial Reports
Track your financial performance:
| Metric | Description |
|---|---|
| Cost per Square Foot | Average cost trends by material |
| Profit Margins | Profit margins by project and material type |
| Revenue Trends | Revenue over time with comparisons |
| Pipeline Summary | Quote and project pipeline distribution |
Open Reports from the sidebar. Use its period picker for a custom range, or click the insights icon in the Reports top bar for Advanced Metrics and previous-period comparisons.
13.5 Commission Reports
Track commission payables and payouts for your sales team:
- Go to More > Reports > Commissions.
- View a summary of:
| Metric | Description |
|---|---|
| Total Commissions | Total commissions earned in the selected period |
| Total Paid | Commissions already paid out |
| Total Pending | Commissions awaiting approval or payment |
| Total Cancelled | Commissions voided (from cancelled projects/orders) |
- Tap a team member's name to see their detailed commission history.
- Filter by date range, status (Pending, Approved, Paid, Cancelled), or team member.
Commission rates are set per client or per project — see Billing > Commission Reports for setup details.
13.6 Time Clock Reports
View time tracking data for your team:
- Go to More > Reports > Time Clock.
- Review:
- Hours worked per team member
- Time spent per project
- Overtime and break tracking
See Calendar > Time Clock for more details on tracking time.